INT adc_summing_init(void)
{
   /* book ADC sum histo */
   hAdcSum = H1_BOOK("ADCSUM", "ADC sum", 500, 0, 10000);

   /* book ADC average in separate subfolder */
   open_subfolder("Average");
   hAdcAvg = H1_BOOK("ADCAVG", "ADC average", 500, 0, 10000);
   close_subfolder();

   return SUCCESS;
}
INT adc_calib_init(void)
{
   char name[256];
   int i;

   /* book CADC histos */
   for (i = 0; i < N_ADC; i++) {
      sprintf(name, "CADC%02d", i);
      HBOOK1(ADCCALIB_ID_BASE + i, name, ADC_N_BINS,
             (float) ADC_X_LOW, (float) ADC_X_HIGH, 0.f);
   }

   return SUCCESS;
}
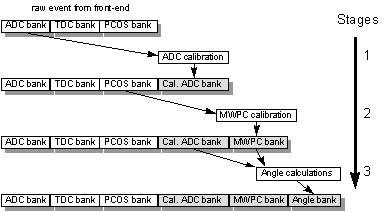
The following MultiStage Concept section describes in more details the analyzer concept and specific of the operation of the demo.
Since data is contained in MIDAS banks, the system knows how to interpret the data. By declaring new bank name in the analyzer.c as possible production data bank, a simple switch in the ODB gives the option to enable the recording of this bank into the result file. The user code for each stage is contained in a "module". Each module has a begin-of-run, end-of-run and an event routine. The BOR routine is typically used to book histograms, the EOR routine can do peak fitting etc. The event routine is called for each event that is received online or off-line.
/* The analyzer name (client name) as seen by other MIDAS clients   */
char *analyzer_name = "Analyzer";
The ODB structure under it has the following fields
[host:expt:S]/Analyzer>ls -l
Key name                        Type    #Val  Size  Last Opn Mode Value
---------------------------------------------------------------------------
Parameters                      DIR
Output                          DIR
Book N-tuples                   BOOL    1     4     1m   0   RWD  y
Bank switches                   DIR
Module switches                 DIR
ODB Load                        BOOL    1     4     19h  0   RWD  n
Trigger                         DIR
Scaler                          DIR
[local:midas:S]/Analyzer>ls -lr output
Key name                        Type    #Val  Size  Last Opn Mode Value
---------------------------------------------------------------------------
Output                          DIR
    Filename                    STRING  1     256   47h  0   RWD  run01100.root
    RWNT                        BOOL    1     4     47h  0   RWD  n
    Histo Dump                  BOOL    1     4     47h  0   RWD  n
    Histo Dump Filename         STRING  1     256   47h  0   RWD  his%05d.root
    Clear histos                BOOL    1     4     47h  0   RWD  y
    Last Histo Filename         STRING  1     256   47h  0   RWD  last.root
    Events to ODB               BOOL    1     4     47h  0   RWD  y
    Global Memory Name          STRING  1     8     47h  0   RWD  ONLN
 [local:midas:S]/Analyzer>ls "Bank switches" -l
 Key name                        Type    #Val  Size  Last Opn Mode Value
 ---------------------------------------------------------------------------
 ADC0                            DWORD   1     4     1h   0   RWD  0
 TDC0                            DWORD   1     4     1h   0   RWD  0
 CADC                            DWORD   1     4     1h   0   RWD  0
 ASUM                            DWORD   1     4     1h   0   RWD  0
 SCLR                            DWORD   1     4     1h   0   RWD  0
 ACUM                            DWORD   1     4     1h   0   RWD  0
 [local:midas:S]/Analyzer>ls "module switches" -l
 Key name                        Type    #Val  Size  Last Opn Mode Value
 ---------------------------------------------------------------------------
 ADC calibration                 BOOL    1     4     1h   0   RWD  y
 ADC summing                     BOOL    1     4     1h   0   RWD  y
 Scaler accumulation             BOOL    1     4     1h   0   RWD  y
ANA_MODULE adc_calib_module = {
   "ADC calibration",           /* module name           */
   "Stefan Ritt",               /* author                */
   adc_calib,                   /* event routine         */
   adc_calib_bor,               /* BOR routine           */
   adc_calib_eor,               /* EOR routine           */
   adc_calib_init,              /* init routine          */
   NULL,                        /* exit routine          */
   &adccalib_param,             /* parameter structure   */
   sizeof(adccalib_param),      /* structure size        */
   adc_calibration_param_str,   /* initial parameters    */
};
     /* subtract pedestal */
    for (i = 0; i < N_ADC; i++)
       cadc[i] = (float) ((double) pdata[i] - adccalib_param.pedestal[i] + 0.5);
  [local:midas:S]Parameters>pwd
 /Analyzer/Parameters
 [local:midas:S]Parameters>ls -lr
 Key name                        Type    #Val  Size  Last Opn Mode Value
 ---------------------------------------------------------------------------
 Parameters                      DIR
     ADC calibration             DIR
         Pedestal                INT     8     4     47h  0   RWD
                                         [0]             174
                                         [1]             194
                                         [2]             176
                                         [3]             182
                                         [4]             185
                                         [5]             215
                                         [6]             202
                                         [7]             202
         Software Gain           FLOAT   8     4     47h  0   RWD
                                         [0]             1
                                         [1]             1
                                         [2]             1
                                         [3]             1
                                         [4]             1
                                         [5]             1
                                         [6]             1
                                         [7]             1
         Histo threshold         DOUBLE  1     8     47h  0   RWD  20
     ADC summing                 DIR
         ADC threshold           FLOAT   1     4     47h  0   RWD  5
     Global                      DIR
        ADC Threshold           FLOAT   1     4     47h  0   RWD  5
 ANA_MODULE *trigger_module[] = {
    &adc_calib_module,
    &adc_summing_module,
    NULL
 };
 BANK_LIST ana_trigger_bank_list[] = {

    /* online banks */
    {"ADC0", TID_STRUCT, sizeof(ADC0_BANK), ana_adc0_bank_str}
    ,
    {"TDC0", TID_WORD, N_TDC, NULL}
    , ...
   ANALYZE_REQUEST analyze_request[] = {
   {"Trigger",                  /* equipment name */
    {1,                         /* event ID */
     TRIGGER_ALL,               /* trigger mask */
     GET_SOME,                  /* get some events */
     "SYSTEM",                  /* event buffer */
     TRUE,                      /* enabled */
     "", "",}
    ,
    NULL,                       /* analyzer routine */
    trigger_module,             /* module list */
    ana_trigger_bank_list,      /* bank list */
    1000,                       /* RWNT buffer size */
    TRUE,                       /* Use tests for this event */
    }
   , ...
 INT analyzer_init()
 {
   HNDLE hDB, hKey;
   char str[80];

   RUNINFO_STR(runinfo_str);
   EXP_PARAM_STR(exp_param_str);
   GLOBAL_PARAM_STR(global_param_str);
   TRIGGER_SETTINGS_STR(trigger_settings_str);

   /* open ODB structures */
   cm_get_experiment_database(&hDB, NULL);
   db_create_record(hDB, 0, "/Runinfo", strcomb(runinfo_str));
   db_find_key(hDB, 0, "/Runinfo", &hKey);
   if (db_open_record(hDB, hKey, &runinfo, sizeof(runinfo), MODE_READ, NULL, NULL) !=
     DB_SUCCESS) {
    cm_msg(MERROR, "analyzer_init", "Cannot open \"/Runinfo\" tree in ODB");
    return 0;
   }
   [ladd00:p3a:Stopped]Module switches>ls
   ADC calibration                 y
   ADC summing                     y
   Scaler accumulation             y
   [ladd00:p3a:Stopped]Module switches>
  INT adc_calib(EVENT_HEADER * pheader, void *pevent)
  {
   INT i;
   WORD *pdata;
   float *cadc;

   /* look for ADC0 bank, return if not present */
   if (!bk_locate(pevent, "ADC0", &pdata))
    return 1;
This defines a section of 8 megabytes or 2 megawords of share memory for HBOOK/Midas data storage. This definition is found in analyzer.c. In case many histograms are booked in the user code, this value probably has to be increased in order not to crash HBOOK. If the analyzer runs online, the section is kept in shared memory. In case the operating system only supports a smaller amount of shared memory, this value has to be decreased. Next, the file contains the analyzer name
char *analyzer_name = "Analyzer";
under which the analyzer appears in the ODB (via the ODBEdit command scl). This also determines the analyzer root tree name as /Analyzer. In case several analyzers are running simultaneously (in case of distributed analysis on different machines for example), they have to use different names like Analyzer1 and Analyzer2 which then creates two separate ODB trees /Analyzer1 and /Analyzer2 which is necessary to control the analyzers individually. Following structures are then defined in analyzer.c: runinfo, global_param, exp_param and trigger_settings. They correspond to the ODB trees /Runinfo, /Analyzer/Parameters/Global, /Experiment/Run parameters and /Equipment/Trigger/Settings, respectively. The mapping is done in the analyzer_init() routine. Any analyzer module (via an extern statement) can use the contents of these structures. If the experiment parameters contain an flag to indicate the run type for example, the analyzer can analyze calibration and data runs differently. The module declaration section in analyzer.c defines two "chains" of modules, one for trigger events and one for scaler events. The framework calls these according to their order in these lists. The modules of type ANA_MODULE are defined in their source code file. The enabled flag for each module is copied to the ODB under /Analyzer/Module switches. By setting this flag zero in the ODB, modules can be disabled temporarily. Next, all banks have to be defined. This is necessary because the framework automatically books N-tuples for all banks at startup before any event is received. Online banks which come from the frontend are first defined, then banks created by the analyzer:
 ...
 // online banks
 { "ADC0", TID_DWORD, N_ADC, NULL },
 { "TDC0", TID_DWORD, N_TDC, NULL },

 // calculated banks
 { "CADC", TID_FLOAT, N_ADC, NULL },
 { "ASUM", TID_STRUCT, sizeof(ASUM_BANK),
  asum_bank_str },
The first entry is the bank name, the second the bank type. The type has to match the type which is created by the frontend. The type TID_STRUCT is a special bank type. These banks have a fixed length which matches a C structure. This is useful when an analyzer wants to access named variables inside a bank like asum_bank.sum. The third entry is the size of the bank in bytes in case of structured banks or the maximum number of items (not bytes!) in case of variable length banks. The last entry is the ASCII representation of the bank in case of structured banks. This is used to create the bank on startup under /Equipment/Trigger/Variables/<bank name>.
The next section in analyzer.c defines the ANALYZE_REQUEST list. This determines which events are received and which routines are called to analyze these events. A request can either contain an "analyzer routine" which is called to analyze the event or a "module list" which has been defined above. In the latter case all modules are called for each event. The requests are copied to the ODB under /Analyzer/<equipment name>/Common. Statistics like number of analyzed events is written under /Analyzer/<equipment name>/Statistics. This scheme is very similar to the frontend Common and Statistics tree under /Equipment/<equipment name>/. The last entry of the analyzer request determines the HBOOK buffer size for online N-tuples. The analyzer_init() and analyzer_exit() routines are called when the analyzer starts or exits, while the ana_begin_of_run() and ana_end_of_run() are called at the beginning and end of each run. The ana_end_of_run() routine in the example code writes a run log file runlog.txt which contains the current time, run number, run start time and number of received events.
If more parameters are necessary, perform the following procedure:
[host:expt:S]ADC calibration>set Pedestal[9] 3
[host:expt:S]ADC calibration>set "Software Gain[9]" 3
[host:expt:S]ADC calibration>create double "Upper threshold"
[host:expt:S]ADC calibration>set "Upper threshold" 400
[host:expt:S]ADC calibration>ls -lr
Key name                        Type    #Val  Size  Last Opn Mode Value
---------------------------------------------------------------------------
ADC calibration                 DIR
    Pedestal                    INT     10    4     2m   0   RWD
                                        [0]             174
                                        [1]             194
                                        [2]             176
                                        [3]             182
                                        [4]             185
                                        [5]             215
                                        [6]             202
                                        [7]             202
                                        [8]             0
                                        [9]             3
    Software Gain               FLOAT   10    4     2m   0   RWD
                                        [0]             1
                                        [1]             1
                                        [2]             1
                                        [3]             1
                                        [4]             1
                                        [5]             1
                                        [6]             1
                                        [7]             1
                                        [8]             0
                                        [9]             0
    Histo threshold             DOUBLE  1     8     53m  0   RWD  20
    Upper threshold             DOUBLE  1     4     3s   0   RWD  400
[host:expt:S]ADC calibration>make
"experim.h" has been written to /home/midas/online
---> adccalib.c
...
fill ADC histos if above threshold
for (i=0 ; i<n_adc ; i++)
if ((cadc[i] > (float) adccalib_param.histo_threshold)
 && (cadc[i] < (float) adccalib_param.upper_threshold))
    HF1(ADCCALIB_ID_BASE+i, cadc[i], 1.f);
In the case global parameter is necessary for several modules, start by doing the step 1 & 2 from the enumeration above and carry on with the following procedure below:
// ODB structures
...
GLOBAL_PARAM     global_param;
...
---> analyzer.c
...
sprintf(str, "/%s/Parameters/Global", analyzer_name);
db_create_record(hDB, 0, str, strcomb(global_param_str));
db_find_key(hDB, 0, str, &hKey);
if (db_open_record(hDB, hKey, &global_param
    , sizeof(global_param), MODE_READ, NULL, NULL) != DB_SUCCESS) {
  cm_msg(MERROR, "analyzer_init", "Cannot open \"%s\" tree in ODB", str);
  return 0;
}
---> adccalib.c
...
extern GLOBAL_PARAM  global_param;
...
where <host name> and <exp name> are optional parameters to connect the analyzer to a remote back-end computer. This attaches the analyzer to the ODB, initializes all modules, creates the PAW shared memory and starts receiving events from the system buffer. Then start PAW and connect to the shared memory and display its contents
PAW > global_s onln
PAW > hist/list
    1  Trigger
    2  Scaler
 1000  CADC00
 1001  CADC01
 1002  CADC02
 1003  CADC03
 1004  CADC04
 1005  CADC05
 1006  CADC06
 1007  CADC07
 2000  ADC sum
For each equipment, a N-tuple is created with a N-tuple ID equal to the event ID. The CADC histograms are created from the adc_calib_bor() routine in adccalib.c. The N-tuple contents is derived from the banks of the trigger event. Each bank has a switch under /Analyzer/Bank switches. If the switch is on (1), the bank is contained in the N-tuple. The switches can be modified during runtime causing the N-tuples to be rebooked. The N-tuples can be plotted with the standard PAW commands:
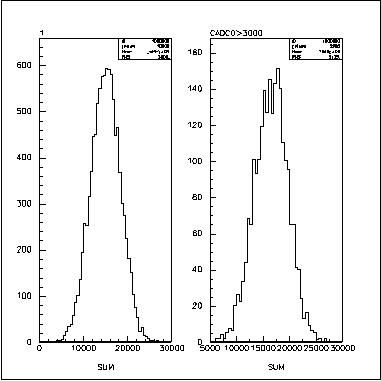
PAW > nt/print 1
...
PAW > nt/plot 1.sum
PAW > nt/plot 1.sum cadc0>3000
While histograms contain the full statistics of a run, N-tuples are kept in a ring-buffer. The size of this buffer is defined in the ANALYZE_REQUEST structure as the last parameter. A value of 10000 creates a buffer which contains N-tuples for 10000 events. After 10000 events, the first events are overwritten. If the value is increased, it might be that the PAWC size (PAWC_DEFINE in analyzer.c) has to be increased, too. An advantage of keeping the last 10000 events in a buffer is that cuts can be made immediately without having to wait for histograms to be filled. On the other hand care has to be taken in interpreting the data. If modifications in the hardware are made during a run, events which reflect the modifications are mixed with old data. To clear the ring-buffer for a N-tuple or a histogram during a run, the ODBEdit command [local]/>hi analyzer <id>
where <id> is the N-tuple ID or histogram ID. An ID of zero clears all histograms but no N-tuples. The analyzer has two more ODB switches of interest when running online. The /Analyzer/Output/Histo Dump flag and /Analyzer/Output/Histo Dump Filename determine if HBOOK histograms are written after a run. This file contains all histograms and the last ring-buffer of N-tuples. It can be read in with PAW:
PAW >hi/file 1 run00001.rz 8190
PAW > ldir
The /Analyzer/Output/Clear histos flag tells the analyzer to clear all histograms and N-tuples at the beginning of a run. If turned off, histograms can be accumulated over several runs.
The RZ files can be analyzed and plotted with PAW. Following flags are available when the analyzer is started off-line:
[Analyzer/Parameters/ADC summing]
Offset = FLOAT : 123